|
Orientation: Exploratory factor analysis is the method of choice with objective personality instruments, particularly to establish the construct validity and construct equivalence of trait-based instruments. Research purpose: This article presents more objective methods to determine the number of factors, most notably parallel analysis and Velicer’s minimum average partial (MAP). The benefits of rotation are also discussed. The article argues for more consistent use of Procrustes rotation and congruence coefficients in factor analytic studies. Motivation for the study: Exploratory factor analysis is often criticised for not being rigorous and objective enough in terms of the methods used to determine the number of factors, the rotations to be used and ultimately the validity of the factor structure. Research design, approach and method: The article adopts a theoretical stance to discuss the best-practice recommendations for factor analytic research in the field of psychology. Following this, an example located within personality assessment and using the NEO-PI-R specifically is presented. A total of 425 students at the University of the Witwatersrand completed the NEO-PI-R. These responses were subjected to a principal components analysis using varimax rotation. The rotated solution was subjected to a Procrustes rotation with Costa and McCrae’s (1992) matrix as the target matrix. Congruence coefficients were also computed. Main findings: The example indicates the use of the methods recommended in the article and demonstrates an objective way of determining the number of factors. It also provides an example of Procrustes rotation with coefficients of agreement as an indication of how factor analytic results may be presented more rigorously in local research. Practical/managerial implications: It is hoped that the recommendations in this article will have best-practice implications for both researchers and practitioners in the field who employ factor analysis regularly. Contribution/value-add: This article will prove useful to all researchers employing factor analysis and has the potential to set the trend for better use of factor analysis in the South African context.
Personality tests are among the most frequently used tests in South Africa (see Foxcroft, Paterson, Le Roux & Herbst, 2004). However, the Employment Equity Act (Republic of South Africa, 1998) states that all tests used in South Africa must be proven to be scientifically reliable, valid and fair. In order to do this, researchers often determine the internal consistency reliability and construct validity of the instrument. Internal consistency reliability is an objective procedure determined by Cronbach’s alpha or Kuder-Richardson coefficients (Moerdyk, 2009; Murphy & Davidshofer, 2005). The equality of reliability coefficients across two groups can also be calculated and provides an objective indication of statistical differences in reliability coefficients across groups. According to Van de Vijver and Leung (1997, p. 60), ‘the statistic to test the equality of two independent reliability coefficients is (1- α1)/(1- α2)’, where α1 and α2 represent the reliabilities (usually Cronbach’s α) of an instrument in two different groups. An F distribution with degrees of freedom N1–1 and N2–1, where N1 and N2 are the sample sizes of each group respectively, is used to determine the significance of the difference between the two reliability coefficients. However, in establishing construct validity and construct equivalence, the methods used are not as clear cut. Interscale correlations, exploratory factor analysis (EFA) and confirmatory factor analysis are commonly used. With personality research, particularly with objective personality tests, EFA is the method of choice. There are a number of decisions that need to be made when using EFA, particularly as they pertain to the number of factors to retain as well as the choice of rotation technique. Furthermore, EFA as a technique is often criticised for its lack of precision and objectivity particularly with regard to the comparison of factorial models. This article presents the technique of Procrustes rotation to be used with EFA as an alternative to confirmatory factor analysis. The discussion also argues for the regular use of congruence coefficients in factor analytic research. Finally, the article presents an example of the use of the techniques discussed. A study conducted on the NEO-PI-R is used for this purpose.
Exploratory factor analysis
EFA is currently the method of choice for examining construct validity and construct equivalence, as evidenced by the number of studies in the Journal of Personality, Journal of Cross-Cultural Psychology and Research in Personality. Two seminal texts in assessment research methods, ‘Methods and data analysis for cross-cultural research’ (Van de Vijver & Leung, 1997) and ‘Psychometric theory’ (Nunnally & Bernstein, 1994), also advocate the use of EFA. Within EFA, principal components analysis is the method most often used, as it is a simple but effective method of determining factors that explain all the variance, including the error variance in any particular correlation matrix (Kline, 1993, 1994). It is also the method used by the developers of most personality instruments (see Cheung et al., 2008; Costa & McCrae, 1992; Millon, 1994). In the discussion to follow, EFA is discussed using the subsections of factor rotation, factor extraction, factor loadings, Procrustes rotation and congruence coefficients.
Factor rotations
Principal components analysis is generally prone to an algebraic artefact, that is, it generally produces one general factor followed by bipolar factors. Hence, it must usually be simplified before it can be interpreted. This is done using rotated factor solutions. According to Nunnally and Bernstein (1994, p. 491), ‘[r]otations place the variables nearer the factors designed to explain them, concentrate the variance of variables upon fewer factors, and, usually, provide factors designed to explain them’. Varimax rotation is the method of choice among researchers and test developers within the field of personality assessment (see Cheung, Cheung, Leung, Ward & Leong, 2003; Cheung et al., 2008; Costa & McCrae, 1992; Henson & Roberts, 2006). Varimax rotation is an orthogonal rotation technique aimed at maximising the sum of variances of squared loadings in the columns of the factor matrix. This produces loadings in each column that are either high or near zero, thereby facilitating interpretation (Kline, 1993, 1994). McCrae and Costa (1989) argued for validimax rotation in personality research, but later concluded that varimax rotations are more appropriate (Costa & McCrae, 2008). Other researchers also sometimes advocate quartimax rotations. However, Nunnally and Bernstein (1994) argue that quartimax rotations are more appropriate for studies that wish to stress a general factor with which all variables correlate. Increasingly, quartimax rotations are giving way to varimax rotations as analytic orthogonal solutions that locate clusters more successfully (Nunnally & Bernstein, 1994). The decision to use varimax rotations is therefore fairly standard. Factor extraction
In terms of factor extraction, six methods are generally advised, namely the Guttman-Kaiser eigenvalue greater-than-one rule (K1 rule), Cattell’s scree test, parallel analysis, Velicer’s minimum average partial (MAP), Bartlett’s test for equality of eigenvalues and maximum likelihood tests (Glorfeld, 1995; Henson & Roberts, 2006). Traditionally, scree plots and the K1 rule are used more than any of the other methods (Hayton, Allen & Scarpello, 2004; Nunnally & Bernstein, 1994). According to Kline (1994), Cattell’s scree test is one of the best methods for selecting the correct number of factors. The rationale for the scree test is that a few major factors account for most of the variance, resulting in a steep ‘cliff’, as these factors are identified first, followed by a shallow ‘scree’ describing the small and relatively consistent variance accounted for by the numerous minor factors. Only factors that occur before the scree and above the breakpoint between the scree and cliff are retained (Hayton et al., 2004). However, researchers (Hayton et al., 2004; Ledesma & Valero-Mora, 2007; O’Connor, 2000) argue that the scree plot involves eyeball searches for sharp demarcations between eigenvalues, which in practice do not always exist. In addition, there is often more than one sharp demarcation point, suggesting that the scree plot is not the most reliable method for factor extraction. The K1 rule is therefore often used in conjunction with the scree plot to determine the number of factors. Hayton et al. (2004) cite Guttman’s (1954) proof as well as Kaiser’s argument that the reliability of a component must always be nonnegative when its eigenvalue is greater than 1 in support of using this method for factor extraction. However, they also argue that this rule is problematic, as Guttman’s proof applies only to the population correlation matrix, and for finite samples the K1 criterion would tend to overestimate the number of factors. The rule is also arbitrary in that it draws distinctions between factors just above and just below 1 (Hayton et al., 2004; Ledesma & Valero-Mora, 2007). Finally, the rule is intended as a lower bound for the rank of the correlation matrix and therefore an upper bound for the number of factors to be retained, but in practice the rule is used as a criterion to determine the exact number of factors to retain (Hayton et al., 2004). Hayton et al. (2004) also cite research evidence that indicates that Bartlett’s test as well as maximum likelihood procedures tend to overfactor and are heavily influenced by sample size. These methods are therefore not suitable alternatives to the scree test and K1 criterion. Hayton et al. (2004) and O’Connor (2000) propose the use of parallel analysis and MAP, as these procedures are statistically based. Parallel analysis is a Monte Carlo simulation technique in which the focus is on the number of factors that account for more variance than the components derived from random data. The eigenvalues obtained from the actual data are compared to the eigenvalues obtained from the random data. If the ith eigenvalue from the actual data is greater than the ith eigenvalue from the random data, the factor is retained (Hayton et al., 2004; Ledesma & Valero-Mora, 2007; O’Connor, 2000). In the original description of the technique by Horn (1965), the mean eigenvalues from the random data served as the comparison baseline. Glorfeld (1995) argues that although Horn’s technique is relatively accurate, it tends to err in the direction of indicating the retention of one or two more factors than is actually warranted and of retaining poorly defined factors. Glorfeld (1995) therefore proposes a modification to Horn’s parallel analysis in which the eigenvalue corresponding to a given percentile, such as the 99th or 95th percentile, of the distribution of random data eigenvalues should be used. Currently, Glorfeld’s modification of Horn’s parallel analysis is recommended (Ledesma & Valero-Mora, 2007; O’Connor, 2000). Velicer’s (1976) MAP test seeks to determine which factors are common and is proposed as a rule to find the best factor solution, rather than to find the cut-off point for the number of factors (Ledesma & Valero-Mora, 2007). In the MAP test, the focus is on the relative amounts of systematic and unsystematic variance remaining in a correlation matrix after extractions of increasing numbers of factors (O’Connor, 2000). Factors are retained as long as the variance in the correlation matrix represents systematic variance. Factors are no longer retained when there is proportionately more unsystematic variance than systematic variance (O’Connor, 2000). Both parallel analysis and the MAP test should result in the same decision regarding the number of factors to retain. However, researchers are encouraged to use both tests, as MAP, when it errs, tends to make errors of underextraction, while parallel analysis tends to err in the direction of overextraction (O’Connor, 2000). Hayton et al. (2004) suggest the use of MAP and parallel analysis and argue that these two methods by themselves are sufficient, but that one can use the scree plot and the K1 criterion as adjuncts to MAP and parallel analysis. Nunnally and Bernstein (1994) and Henson and Roberts (2006) strongly support this suggestion. In the example to follow, I present all four methods to demonstrate the merits and limitations of the methods, as suggested. O’Connor (2000) presents SAS syntax for conducting both MAP and parallel analysis procedures. These were used in the study described below. In addition to the empirical methods used in deciding the number of factors to extract, one also needs to consider the theoretical specifications for the instruments or models being studied. Therefore, both theoretical and empirical considerations can provide a more objective and reliable way of establishing the number of factors to be extracted. Factor loadings
Kline (1994) reports that once the factor analyses are conducted, it is usual to regard factor loadings1 as high if they are greater than 0.60 and moderately high if they are above 0.30. Other loadings can be ignored. However, studies using the NEO-PI-R generally only consider loadings above 0.40 (see McCrae, Terracciano & 78 Members of the Personality Profiles of Cultures’ Project, 2005). This decision seems to be rule of thumb, but agreement among researchers in personality research appears to be that factor loadings above the 0.30 cut-off point are generally acceptable, but that 0.40 is preferable. Procrustes rotation
Debate exists in the literature on whether it is better to use exploratory or confirmatory factor analysis in studies exploring personality factor structure. EFA is useful in that it provides information on a factor structure for a particular group. However, when drawing a comparison between a factor structure and a theoretically proposed factor structure or when comparing the factor structures across two groups, confirmatory factor analysis is recommended. McCrae, Zonderman, Bond and Paunonen (1996) make a convincing argument for the use of EFA and Procrustes rotation instead of confirmatory factor analysis. Firstly, according to McCrae et al. (1996), there is no theoretical reason to assume that all personality scales load on only one factor. Secondly, secondary loadings in a factor structure can be meaningful and replicable. Even though a limited number of secondary loadings may be specified in a confirmatory factor analysis, the most appropriate model should be a model in which all scales are allowed to load on all factors. Despite the lack of goodness-of-fit indices as in confirmatory factor analysis, McCrae et al. (1996) suggest that the degree of replication can be evaluated by orthogonal Procrustes rotation and congruence coefficients. This is supported by Van de Vijver and Leung (1997), who argue that this should become the standard for factor analytic studies of construct equivalence. Van de Vijver and Leung (1997) argue that the spatial orientation of factors in a factor analysis is arbitrary. Factors therefore need to be rotated with regard to each other so as to be able to calculate a meaningful measure of agreement. Prior to evaluating the agreement of factors between two groups, the matrices of loadings are therefore rotated with regard to each other so as to maximise their agreement. This is called target rotation. Factor loadings of the second group are rotated towards the first group (target group). This is usually done using Procrustes rotation. Therefore, in Procrustes rotation, the initial factor structures are rotated orthogonally as closely as possible to a target structure (Mulaik, 1972, Van de Vijver & Leung, 1997). The choice of the target group and the second group can be arbitrary or may be dictated by theoretical or empirical findings. In the example below, the level of agreement between the factors obtained by Costa and McCrae (1992) in their standardisation sample and the varimax rotated matrix obtained in the present study were examined. Costa and McCrae’s matrix is therefore the target matrix. Congruence coefficients
Following Procrustes rotation, factor congruence coefficients are computed to quantify the degree to which a factor structure is replicated (Wrigley & Neuhaus, 1955). A number of congruence 1.Factor loadings may be regarded as correlations of the variables with the factors (Kline, 1994).coefficients are proposed in the literature. The most widely used is the Tucker’s phi coefficient of agreement – sometimes also referred to as the coefficient of proportionality (Van de Vijver & Leung, 1997). However, other indices of agreement may also be used, such as the identity coefficient, the linearity coefficient, phi and the additivity coefficient. The identity coefficient is the most stringent coefficient, as it is influenced by additive and multiplicative transformations. The linearity coefficient, also known as the classic product-moment correlation, is not influenced by additive or multiplicative transformations. Tucker’s phi is influenced by additive transformations but not multiplicative ones, while the additivity coefficient is not influenced by additive transformations but by multiplicative transformations (Van de Vijver & Leung, 1997). The formulae for calculating each of these coefficients are given in Table 1. When determining level of agreement, several rules of thumb exist. Cheung et al., (2003), McCrae et al., (1996) and Mulaik (1972) propose that factor congruence coefficients of 0.9 or greater generally indicate adequacy of fit. Van de Vijver and Leung (1997, p. 92) argue that values greater than 0.95 provide evidence for factorial similarity, whereas values smaller than 0.85 indicate non-negligible incongruities. Van de Vijver and Leung (1997) therefore propose that more than one congruence coefficient be calculated to ensure more valid conclusions of agreement. McCrae et al. (1996) argue that the 0.90 cut-off point is a valid one, as values of 0.9 or greater are virtually never produced by chance. To evaluate this more clearly, Paunonen, Jackson, Trzebinski and Forsteling (1992) propose a Monte Carlo simulation that allows one to assess at the 95% level whether the fit of real data is due to capitalisation on chance. McCrae et al. (1996) provide a SAS program to use in conducting Procrustes rotations. This program includes the calculation of factor congruence coefficients as well as the evaluation of these coefficients at the 1% and 5% levels. This program was used to conduct the Procrustes rotation and to calculate congruence coefficients in the example below.
Research approach
A quantitative, non-experimental, cross-sectional design was used in this study. Students completed a questionnaire incorporating some demographic information and the NEO-PI-R at one point in time with no manipulation, randomisation or division into groups.
Research method
Participants and sampling
A convenience sample of 425 students at the University of the Witwatersrand completed the NEO-PI-R as part of a larger study considering the applicability of the NEO-PI-R and the CPAI-2 in the South African context. All students were in their second or subsequent years of study. The students ranged in age from 17 to 50 years with a mean of 21.3 (SD = 3.81). Of the total sample, 28.71% were male (n = 122) and 71.29% were female (n = 303). In terms of population groupings, 44.47% classified themselves as White (n = 189), 28.47% as Black (n = 120), 17.88% as Indian (n = 76), 6.35% as Coloured (n = 27) and 2.12% (n = 9) as Asian, for example Chinese and Taiwanese, whilst 0.71% (n = 3) chose the 'Other' option without specifying their grouping. Language groupings were distributed as follows: 68.47% of the sample reported English as their home language (n = 302), 2.35% spoke Afrikaans as their home language (n = 10), while 14.18% (n = 102) of the sample spoke an African language and 5% (n = 22) selected the 'Other' option, specifying Chinese, Taiwanese, and so forth as their home language. Measuring instrument
The NEO-PI-R is a self-report instrument consisting of 240 items that takes approximately 40 minutes to complete. The NEO-PI-R measures each of the five factors postulated in the five-factor model (FFM) of Personality through 48 items each, which are further subdivided into six sets of eight items. These clusters or facets of items were designed to provide more detailed information on some of the more important concepts within each of the five domains. NEO-PI-R items are answered on a five-point Likert-type scale, ranging from 4 ('strongly agree') to 0 ('strongly disagree'), where the scales are balanced to control for the effects of acquiescence (Costa & McCrae, 1992). Reliability and validity of the NEO-PI-R have been demonstrated internationally (see Costa & McCrae, 1992; Costa & McCrae, 2008; McCrae et al., 2005) and locally (see Laher & Quy, 2009; Rothman & Coetzer, 2003; Storm & Rothman, 2003). In this study, internal consistency reliability coefficients of 0.91, 0.89, 0.87, 0.87 and 0.92 were found for the NEO-PI-R domain scales of Neuroticism, Extraversion, Openness to experience, Agreeableness and Conscientiousness, respectively. Reliability coefficients for the facet scales ranged between 0.50 and 0.81. Procedure
Ethical clearance was obtained from the Committee for Research on Human Subjects at the University of the Witwatersrand. Students were approached during their lectures and were asked to participate in the study by completing the questionnaire. Students were briefed verbally about the aims of the study. Anonymity and confidentiality were stressed and students were also made aware that participation was voluntary. Each questionnaire also included a cover letter, which students were requested to detach and retain. The cover letter emphasised anonymity, confidentiality and the voluntary nature of the study. Contact details and the option to receive feedback on general trends were also provided. Data analysis
Responses on the NEO-PI-R were factor analysed using principal components analysis and varimax rotation. The decision on the number of factors to extract was made based on the scree plot (see Figure 1), the K1 criterion, the parallel analysis and MAP techniques as well as the FFM within which the NEO-PI-R is located. Following this, a Procrustes rotation was conducted with Costa and McCrae’s (1992) normative sample matrix as the target matrix. Finally, congruence coefficients were computed.
Table 2 presents the actual eigenvalues obtained for the NEO-PI-R in this study together with the random eigenvalues calculated using Horn’s (1965) technique and the more recent technique proposed by Glorfeld (1995). Table 3 presents the results obtained from the five-factor solution that was extracted using varimax rotation. From the varimax solution it is evident that the five factors load as expected. In total, the five-factor solution explained 56.73% of the shared variance. Factor 1 explains 17.86% of the variance, Factor 2 explains 12.78%, Factor 3 explains 11.07%, Factor 4 explains 9.19% and Factor 5 explains 5.83%. Factor 1 may be described as the Conscientiousness factor with all six Conscientiousness facets loading positively with moderate to high loadings on this factor. Two Extraversion facets, namely Assertiveness and Activity, also load positively on Factor 1, with a small secondary loading of 0.41. These facets load with a higher loading on Factor 4, the Extraversion factor. The second factor had moderate to high loadings on all the Neuroticism facets. Only Impulsiveness had a small loading (0.44) on this factor. Factor 3 is best defined as the Agreeableness factor with all six Agreeableness facets loading positively with moderate to high loadings on this factor. Angry hostility loads negatively (-0.45) and Warmth loads positively (0.42) on Factor 3, but the higher loading for both facets occurs on their respective domains. Factor 4 had moderate to high loadings on all the Extraversion facets, with the exception of Assertiveness, which had a moderate to small loading. Finally, Factor 5 was characterised by moderate to high loadings on all the Openness to experience facets, with the exception of Actions, which had a loading of 0.34 on Factor 5 and -0.38 on Factor 2. The results for the Procrustes rotation and congruence coefficients are also presented in Table 3. From the Procrustes results it is evident that sufficient agreement exists between Costa and McCrae’s (1992) results and those from this study. With the exception of Fantasy, Actions, Trust and Altruism, which have congruence coefficients of between 0.91 and 0.93 (α = 0.05), all other facets have congruence coefficients above 0.94, indicating agreement at the 0.01 level of significance.
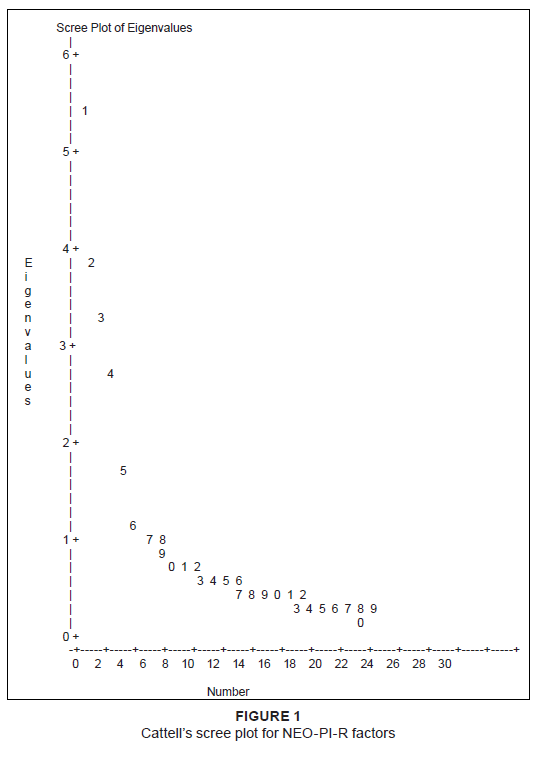 |
Figure 1: Cattell’s scree plot for NEO-PI-R factors
|
|
EFA is a commonly used technique for establishing the construct validity and construct equivalence of psychometric tests, most notably personality tests. Furthermore, as the Employment Equity Act (Republic of South Africa, 1998) stipulates that all psychometric instruments must be reliable, valid and fair, it is imperative that one employs rigorous statistical methods to do this. This article discussed EFA and the various decisions and techniques associated with it primarily as they pertain to objective personality tests. This was done to promote best practice in the South African context when EFA is employed in research and/or practice. An example using the NEO-PI-R was presented to illustrate the use of the techniques discussed. From the results presented on the NEO-PI-R data, the following were evident. On a theoretical level, the FFM postulates five broad factors. Empirical examination of Cattell’s scree plot (see Figure 1) suggests six factors. Using the eigenvalues greater than 1 rule, six factors are also indicated. Both parallel analysis results indicate the extraction of five factors. Velicer’s MAP technique also indicates the extraction of five factors. Hence, a five-factor solution is regarded as the most optimal solution for the NEO-PI-R results in this study. However, these results demonstrate the better accuracy of the parallel analysis and MAP results. From the varimax rotated results in Table 3, it is evident that the five factors loaded as postulated by Costa and McCrae (1992). There were some cross-loadings, but as indicated by Costa and McCrae (1992), these cross-loadings will occur because aspects of personality are related; however, the higher loading will always be seen on the factor on which the facet should load theoretically. These cross-loadings were congruent with this argument. With the exception of the Actions (Openness domain), the facets maintained their loadings on the relevant domain. The Actions facet had its highest loading of -0.38 on Factor 2, the Neuroticism factor. The second highest loading (0.34) was on the Openness to experience factor. Therefore, it is possible to conclude that the structure of the NEO-PI-R and by implication the FFM holds in this South African sample. Contrary to research that indicated that African and South African samples do not replicate the five-factor structure adequately (see Matsimbi, 1997; McCrae et al., 2005; Piedmont, Bain, McCrae & Costa, 2002; Teferi, 2004), this study demonstrated that a five-factor solution was clearly recoverable. This finding is supported by the results obtained on the Procrustes solution. All domain scales had congruence coefficients exceeding 0.96. Facet scales also had all congruence coefficients exceeding 0.94 and significant at the 0.01 level of significance, except for the Openness to experience facets of Fantasy and Actions and the Agreeableness facet of Trust. These three facets had congruence coefficients exceeding 0.91, which were significant at the 0.05 level of significance. Therefore, there was sufficient agreement with the normative sample to support evidence for the utility of the NEO-PI-R and by extension the FFM in a sample of South African university students. These results concur with those of Heuchert, Parker and Stumpf (2000). All 30 facet scores in Heuchert et al.’s (2000) study had a loading of at least 0.40 on the hypothesised domain. Only two facet scores showed secondary loadings at or above 0.40 on another domain in addition to the hypothesised domain. Angry hostility loaded negatively and Warmth loaded positively on the Agreeableness factor. Congruence coefficients were also in line with those found in Heuchert et al.’s study (2000). This provides further evidence that the NEO-PI-R and the FFM are applicable in the South African context. Two points to note, however, are, (1) the problematic nature of the Actions (Openness to experience) facet and (2) the order of the factor loadings. Openness to actions is characterised by the willingness to try different activities, visit new places or try new foods (Costa & McCrae, 1992). According to Costa and McCrae (1992), high scorers on this scale prefer novelty and variety, while low scorers prefer familiarity and routine and find change difficult. It is evident from the reliability analysis that Actions had a moderate reliability coefficient in the normative sample (α = 0.58) as well as in this study (α = 0.55). Given this, one has to question whether there are more implicit problems with the scale and its items. Certainly the definitions are clear enough, but perhaps the items do not come across clearly or individuals cannot identify with the situations depicted by the items. The second point refers to the order of factor loadings. McCrae and Costa (1992) suggest that the factors load with Neuroticism on Factor 1, Extraversion on Factor 2, Openness to experience on Factor 3, Agreeableness on Factor 4 and Conscientiousness on Factor 5. In total, the five-factor solution explained 56.73% of the shared variance. In the five-factor solution for this study, Factor 1 emerges as a Conscientiousness factor and explains 17.86% of the variance. Factor 2 is defined by loadings on the Neuroticism factor and explains 12.78% of the variance. Factor 3 is the Agreeableness factor and explains 11.07% of the variance. Factor 4 is the Extraversion factor and explains 9.19% of the variance, while Factor 5 is the Openness to experience factor and explains 5.83% of the variance. Given the loadings and the percentage of variance explained by each of the domains, it is possible that certain factors may contribute more towards personality, life and culture in this South African student sample. However, this claim requires more empirical research. In addition, I did not have access to the percentage of variance explained by each of the factors in the normative sample, which made comparisons impossible. Despite this, the NEO-PI-R does appear to have adequate construct validity in the South African context. The use of varimax and Procrustes rotation therefore allows conclusions to be made about the NEO-PI-R in the South African context (varimax result) as well as comparisons of the NEO-PI-R responses in South Africa to those in America (Procrustes result), which have important implications for psychometric theory and research, etic versus emic debates and personality theory and assessment.
Conclusion
In conclusion, this article presented a process for conducting factor analysis, particularly when using personality tests, although not solely for these tests. This method may be used for most psychometric research to provide more rigorous and reliable research. There are two techniques that this article did not discuss, namely Rasch modelling and item parcelling, as personality tests generally have a large number of items. However, the reader is referred to De Bruin (2004) for further arguments on these techniques. It is hoped that this article will prove useful to all researchers employing factor analysis and that it will set the trend for better use of factor analysis in the South African context.
Cheung, F., Cheung, S., Leung, K., Ward, C., & Leong, F. (2003). The English version of the Chinese Personality Inventory. Journal of Cross-Cultural Psychology, 34, 433–452. Cheung, F., Cheung, S., Zhang, J., Leung, K., Leong, F., & Yeh, K.H. (2008). Relevance of Openness as a personality dimension in Chinese culture: Aspects of its cultural relevance. Journal of Cross-Cultural Psychology, 39, 81–108. Costa, P.T., & McCrae, R.R. (1992). NEO-PI-R professional manual. Florida: Psychological Assessment Resources. Costa, P.T., & McCrae, R.R. (2008). The Revised NEO Personality Inventory. In G.J. Boyle, G. Matthews & D.H. Saklofske (Eds.), The Sage handbook of personality theory and assessment (pp. 179–199). London: Sage. De Bruin, G.P. (2004). Problems with the factor analysis of items: Solutions based on item response theory and item parceling. South African Journal of Industrial Psychology, 30, 16–26. Foxcroft, C., Paterson, H., Le Roux, N., & Herbst, D. (2004). Psychological assessment in South Africa: A needs analysis. Pretoria: HSRC. Glorfeld, L.W. (1995). An improvement on Horn’s parallel analysis methodology for selecting the correct number of factors to retain. Educational and Psychological Measurement, 55, 377–393. Hayton, J.C., Allen, D.G., & Scarpello, V. (2004). Factor retention decisions in EFA: A tutorial on parallel analysis. Organisational Research Methods, 7, 191–205. Henson, R.K., & Roberts, J.K. (2006). Use of EFA in published research: Common errors and some comment on improved practice. Educational and Psychological Measurement, 66, 393–416. Heuchert, J.W.P., Parker, W.D., & Stumpf, H. (2000). The Five Factor Model of Personality in South African college students. American Behavioural Scientist, 44, 112–125. Horn, J.L. (1965). A rationale and test for the number of factors in factor analysis. Psychometrika, 30, 179–185. Kline, P. (1993). Personality: The psychometric view. New York: Routledge. Kline, P. (1994). An easy guide to factor analysis. London: Routledge. Laher, S., & Quy, G. (2009). Exploring the role of spirituality in the context of the Five Factor Model of Personality in a South African sample. Journal of Psychology in Africa, 19, 513‑521. Ledesma, R.D., & Valero-Mora, P. (2007). Determining the number of factors to retain in EFA: An easy-to-use computer program for carrying out parallel analysis. Practical Assessment, Research and Evaluation, 12, 1–11. Matsimbi, W.E. (1997). Cross-cultural generalisability of the Five Factor Model: A study on South African white collar males. Unpublished master’s thesis, University of the Witwatersrand, South Africa. McCrae, R.R., & Costa, P.T. (1989). Rotation to maximize the construct validity of factors in the NEO-Personality Inventory. Multivariate Behavioural Research, 24, 107–124. McCrae, R.R., Terracciano, A., & 78 Members of the Personality Profiles of Cultures Project. (2005). Universal features of personality traits from the observers’ perspective: Data from 50 cultures. Journal of Personality and Social psychology, 88, 547–561. McCrae, R.R., Zonderman, A.B., Bond, M.H., & Paunonen, S.V. (1996). Evaluating replicability of factors in the Revised NEO Personality Inventory: Confirmatory factor analysis versus procrustes rotation. Journal of Social and Personality Psychology, 70, 552–566. Millon, T. (1994). Millon Index of Personality Styles manual. Orlando: The Psychological Corporation. Moerdyk, A. (2009). The principles and practice of psychological assessment. Pretoria: Van Schaik. Mulaik, S.A. (1972). The foundations of factor analysis. New York: McGraw-Hill. Murphy, K.R., & Davidshofer, C.O. (2005). Psychological testing: Principles and applications. New Jersey: Prentice Hall. Nunally, J.C., & Bernstein, I.H. (1994). Psychometric theory. New York: McGraw-Hill. O’Connor, B. (2000). SPSS and SAS programs for determining the number of components using parallel analysis and Velicer’s MAP test. Behavior Research Methods, Instruments and Computers, 32, 396–402. Paunonen, S.V., Jackson, D.N., Trzebinski, J., & Forsteling, F. (1992). Personality structure across cultures: A multimethod evaluation. Journal of Personality and Social Psychology, 62, 447–456. Piedmont, R.L., Bain, E., McCrae, R.R., & Costa, P.T. Jr. (2002). The applicability of the Five Factor Model in a sub-Saharan culture: The NEO-PI-R in Shona. In R.R. McCrae & J. Allik (Eds.), The Five-Factor Model of Personality across cultures (pp. 155–175). New York: Kluwer Academic. Republic of South Africa. (1998). Employment Equity Act, No. 55 of 1998. Pretoria: Government Printers. Rothman, S., & Coetzer, E.P. (2003). The Big Five personality dimensions and job performance. South African Journal of Industrial Psychology, 29, 68–74. Storm. K., & Rothman, S. (2003). The relationship between burnout, personality traits and coping strategies in a corporate pharmaceutical group. South African Journal of Industrial Psychology, 29, 35–42. Teferi, T.B. (2004). The application of the NEO-PI-R in the Eritrean context. Unpublished master’s thesis, University of the Witwatersrand, South Africa. Van de Vijver, F., & Leung, K. (1997). Methods and data analysis for cross cultural research. Newbury Park: Sage. Velicer, W.F. (1976). Determining the number of components from the matrix of partial correlations. Psychometrika, 41, 321–327. Wrigley, C.S., & Neuhaus, J.O. (1955). The matching of two sets of factors. American Psychologist, 10, 418–419
|

